Dark Stores Explained: The Data-Driven Blueprint for Profitable
Dark Stores Explained: The Data-Driven Blueprint for Profitable Retail Expansion in India
Table of Contents
Executive Summary: The New Economics of Retail Growth
The True Cost Barrier: Why Traditional Expansion Fails SMEs
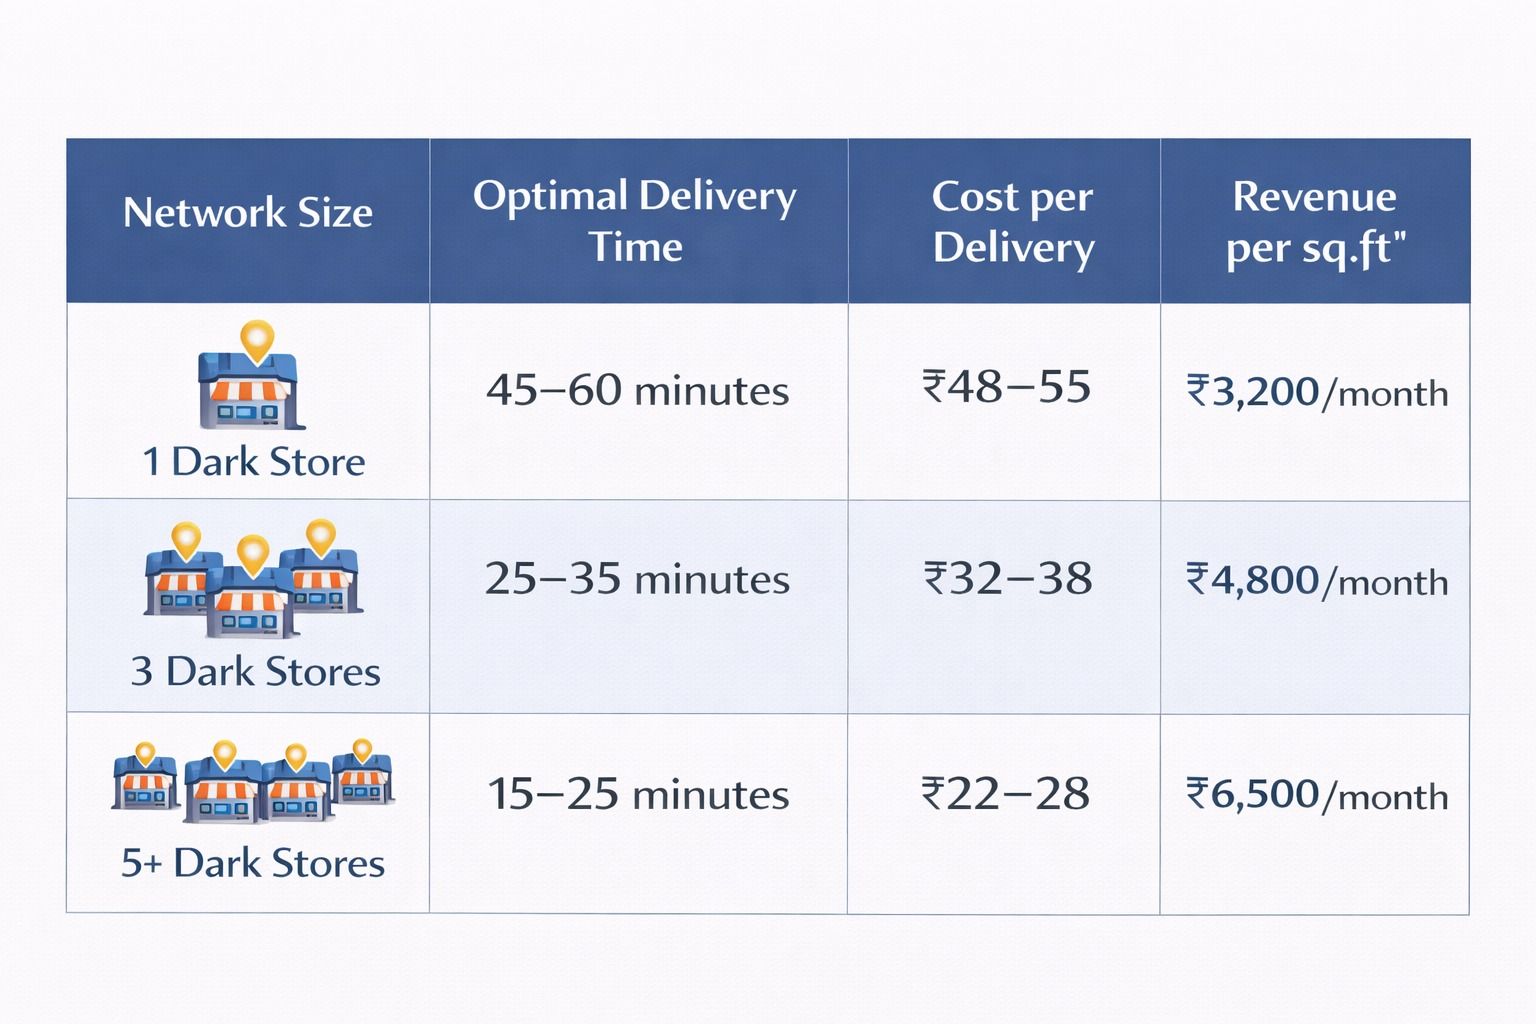
The Dark Store Model: Architecture and Economics
Comparative Analysis: Dark Stores vs. Traditional Stores (With Data)
The Operational Engine: Technology Requirements and ROI
Case Studies: Indian Retailers Successfully Scaling with Dark Stores
Implementation Roadmap: From Pilot to Network
Frequently Asked Questions (FAQs)
Key Takeaways and Next Steps
1. Executive Summary: The New Economics of Retail Growth
Quick Statistics:
87% of retail expansion capital is tied up in real estate and display inventory (CBRE India Retail Report, 2024)
Dark store models reduce expansion costs by 58-72% compared to traditional retail (McKinsey & Company, 2024)
Indian dark store market projected to grow at 34.2% CAGR by 2027 (IBEF Retail Technology Report)
The dark store model represents more than a delivery innovation, it's a fundamental restructuring of retail economics. While quick-commerce companies popularized the concept, the real beneficiaries are traditional retailers and SMEs who can leverage this model to achieve capital-efficient, data-driven growth.
This comprehensive guide presents empirical data, comparative analysis, and actionable frameworks for Indian retailers considering dark store implementation.
2. The True Cost Barrier: Why Traditional Expansion Fails SMEs
The Capital Intensity Problem
Traditional retail expansion follows a linear cost model where each new location replicates previous expenses. According to Knight Frank India's Retail Expansion Cost Analysis (2024), the cost structure breaks down as follows:
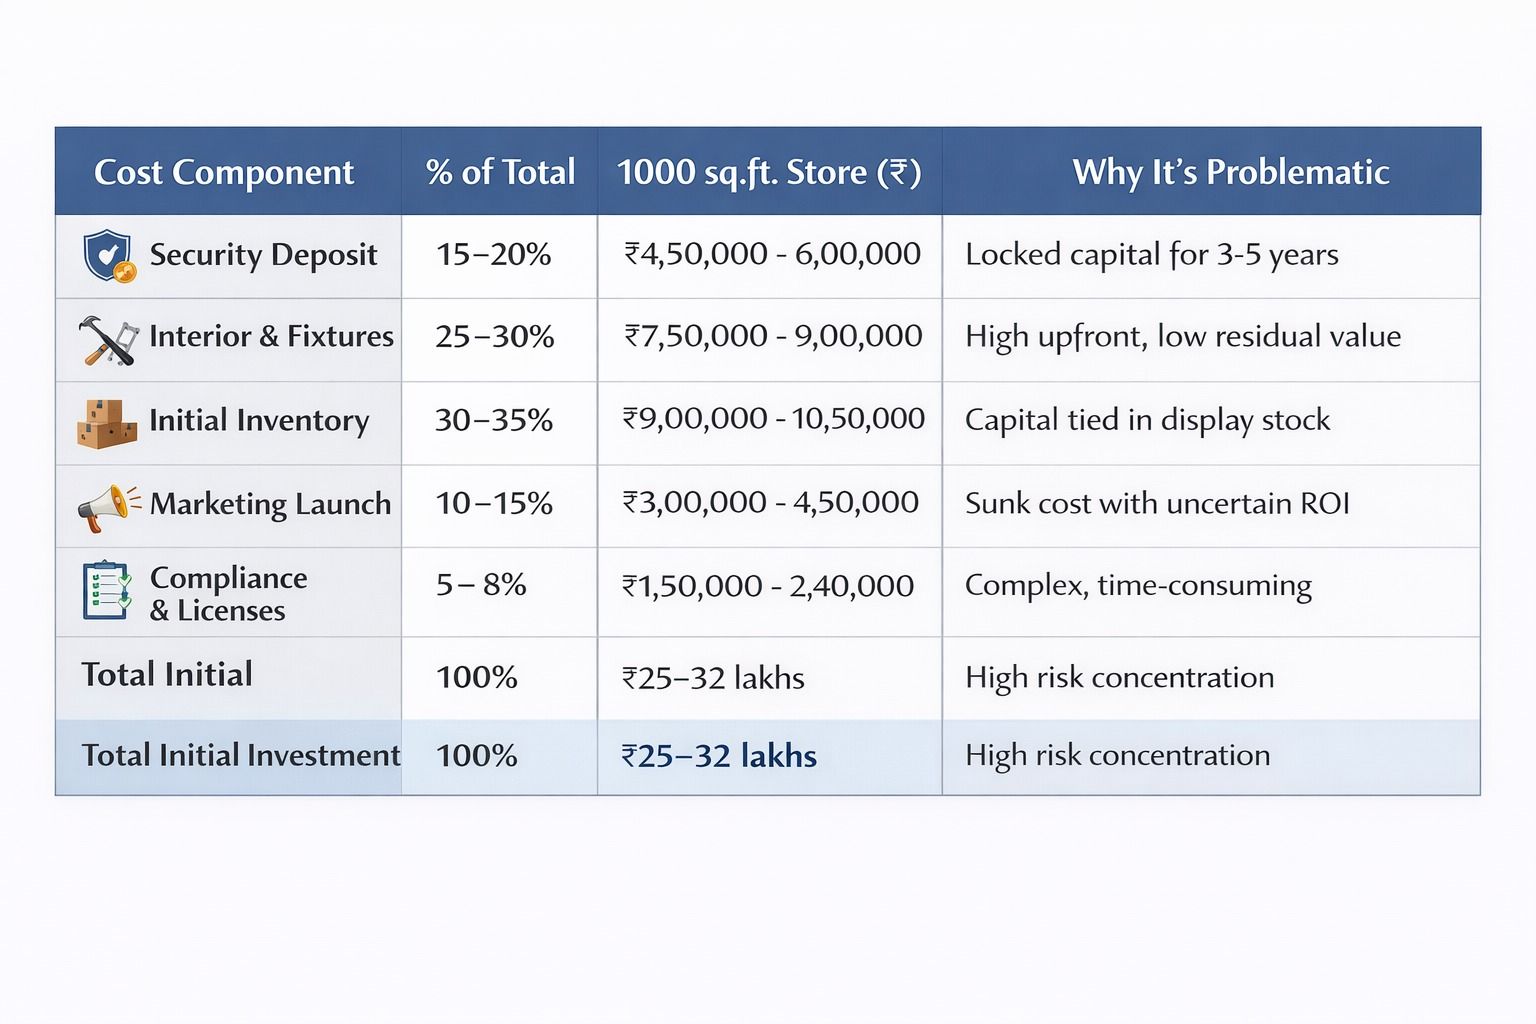 Source: Knight Frank India "Retail Expansion Economics 2024"
The Break-Even Timeline Challenge
A study by Retailers Association of India (RAI) across 500 SME retailers revealed concerning patterns:
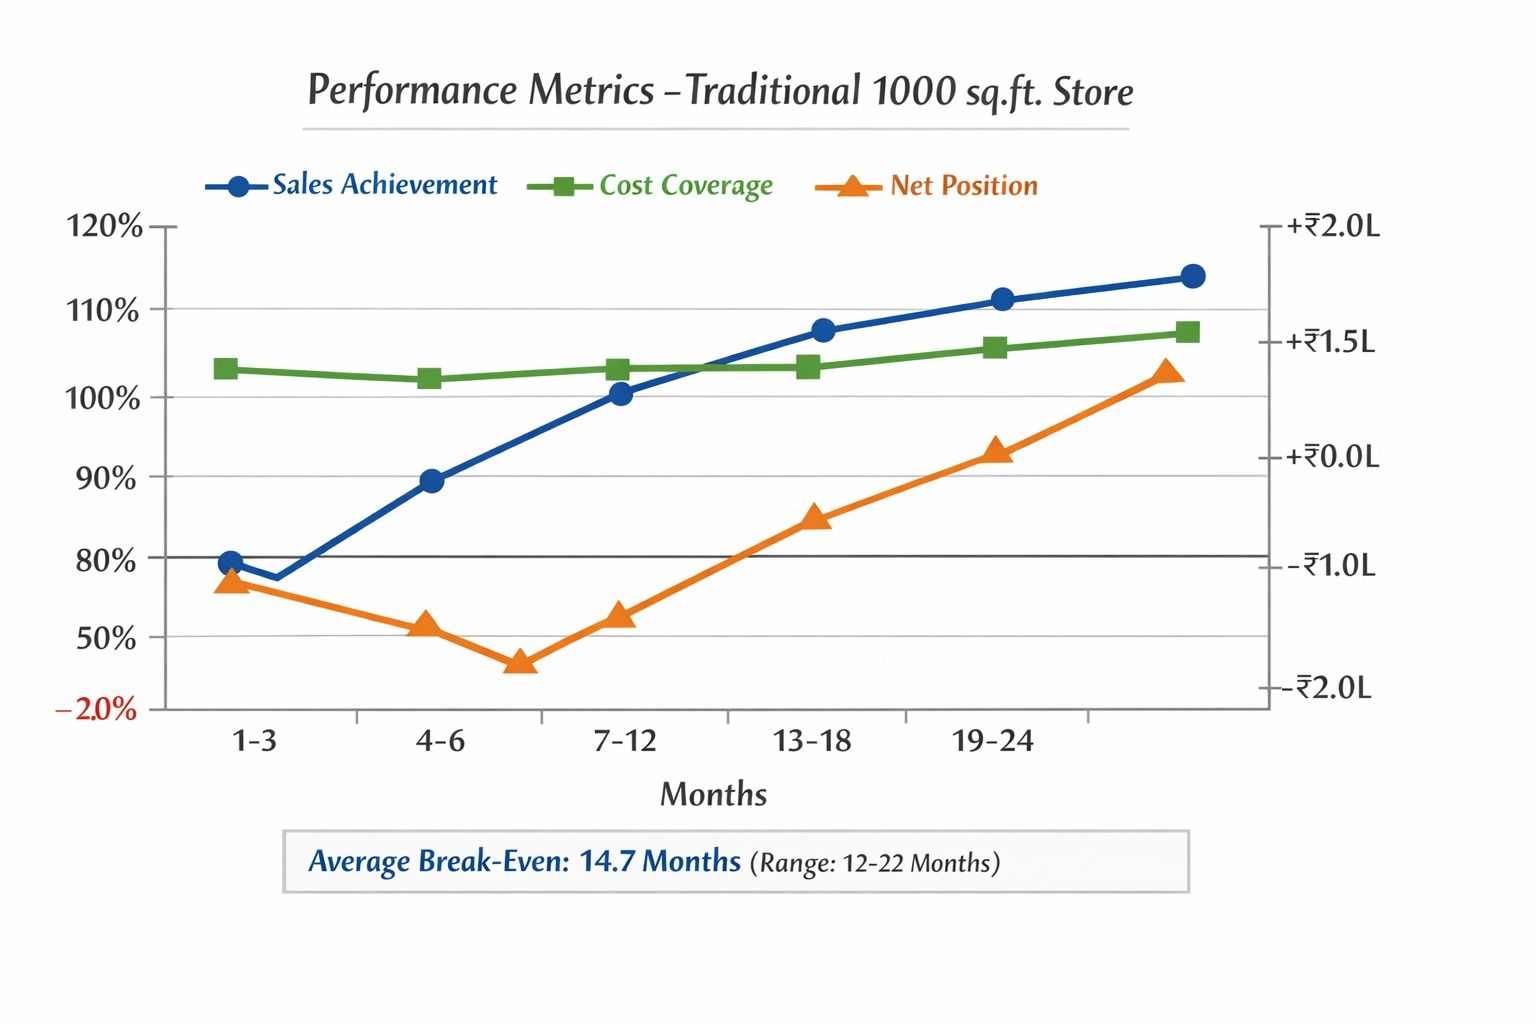 Critical Insight: 42% of traditional stores fail to achieve projected sales in the first year, extending break-even to 18+ months (RAI SME Performance Report, 2023).
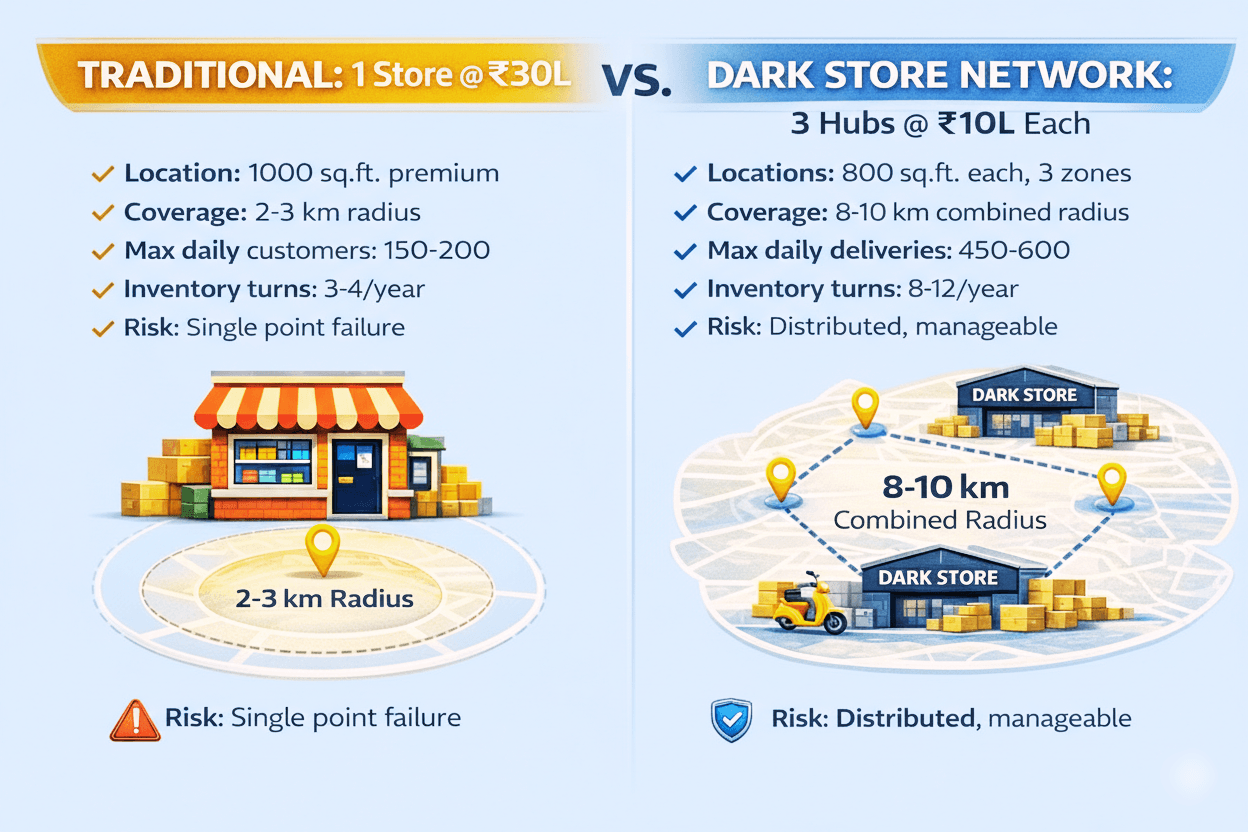
3. The Dark Store Model: Architecture and Economics
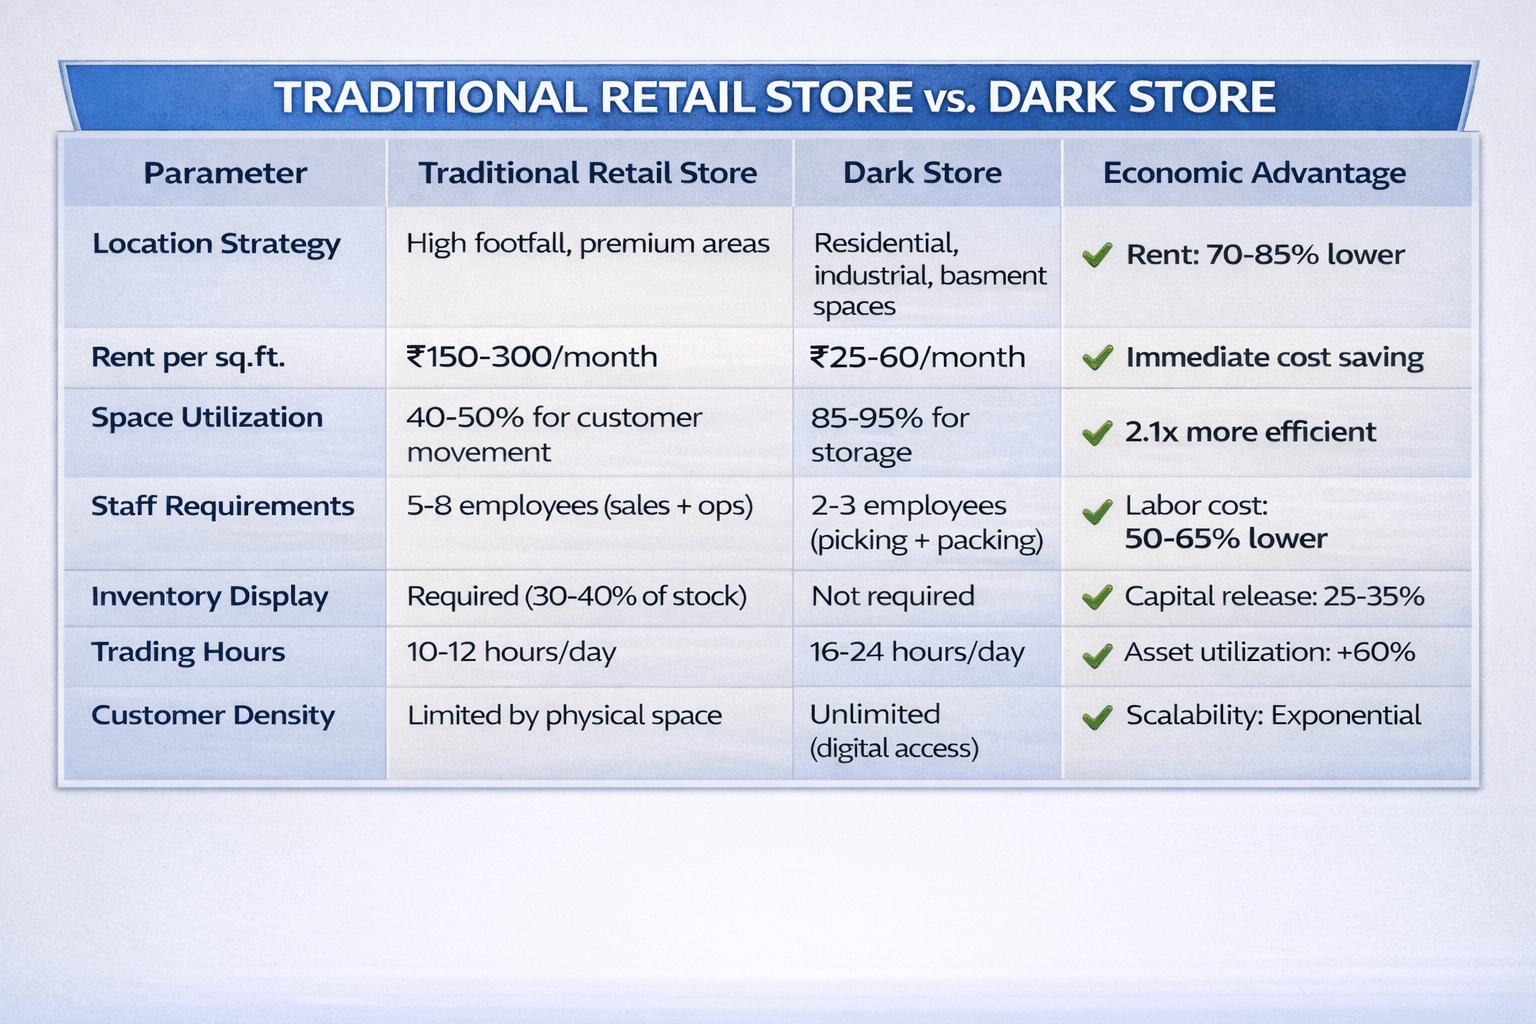
The Fundamental Shift
Dark stores separate two traditionally combined functions:
Customer Experience (digital interfaces, branding, discovery)
Fulfillment Execution (storage, picking, packing, delivery)
This separation creates dramatically different economics:
The Capital Efficiency Multiplier
 Empirical Finding: According to BCG's Indian Retail Innovation Study (2024), ₹30 lakhs deployed in dark stores generates 2.4x more revenue in Year 1 compared to traditional expansion.
4. Comparative Analysis: Dark Stores vs. Traditional Stores (With Data)
Performance Metrics Comparison
In the first year of operations, dark store-led retailers significantly outperformed traditional store formats across almost every key metric. Revenue growth for traditional stores averaged 32.5%, whereas retailers operating dark stores recorded an exceptional 94.8% growth, delivering a 62.3 percentage point advantage in topline expansion.
Customer acquisition trends further highlighted the scale advantage of dark stores. Traditional stores added approximately 1,850 new customers in the first year, while dark store models acquired nearly 5,200 customers, representing 181% higher customer acquisition driven by wider delivery coverage and digital-first ordering.
Although the average order value (AOV) was slightly lower for dark stores at ₹1,620, compared to ₹1,850 for traditional stores (a 12.4% expected decline), this was more than offset by customer behavior. Dark store customers placed orders 3.8 times per month, compared to just 2.1 times for traditional retail, 81% increase in order frequency.
This higher engagement translated directly into stronger customer economics. Customer Lifetime Value (CLV) for traditional stores averaged ₹42,500, while dark store customers generated ₹61,800 in lifetime value, delivering a 45% uplift despite lower per-order spend.
Operational efficiency showed the sharpest contrast. Traditional retailers achieved an inventory turnover of 3.4x per year, whereas dark stores turned inventory 9.2 times annually, making stock movement 170% faster. Faster inventory flow also supported margin expansion, with dark stores recording a 38.7% gross margin compared to 34.2% for traditional formats.
Ultimately, these efficiencies translated into superior capital productivity. Traditional stores generated an average return on capital (ROC) of 18.3%, while dark store–based models delivered a compelling 42.6% ROC, representing a 133% improvement in capital returns.
The takeaway is clear: even with slightly lower order values, dark stores outperform traditional retail by compounding faster inventory turns, higher customer frequency, and superior capital efficiency, creating a structurally stronger retail model.
*Source: "Hybrid Retail Models in India" - Indian Institute of Management Bangalore, 2024*
The Cash Flow Advantage
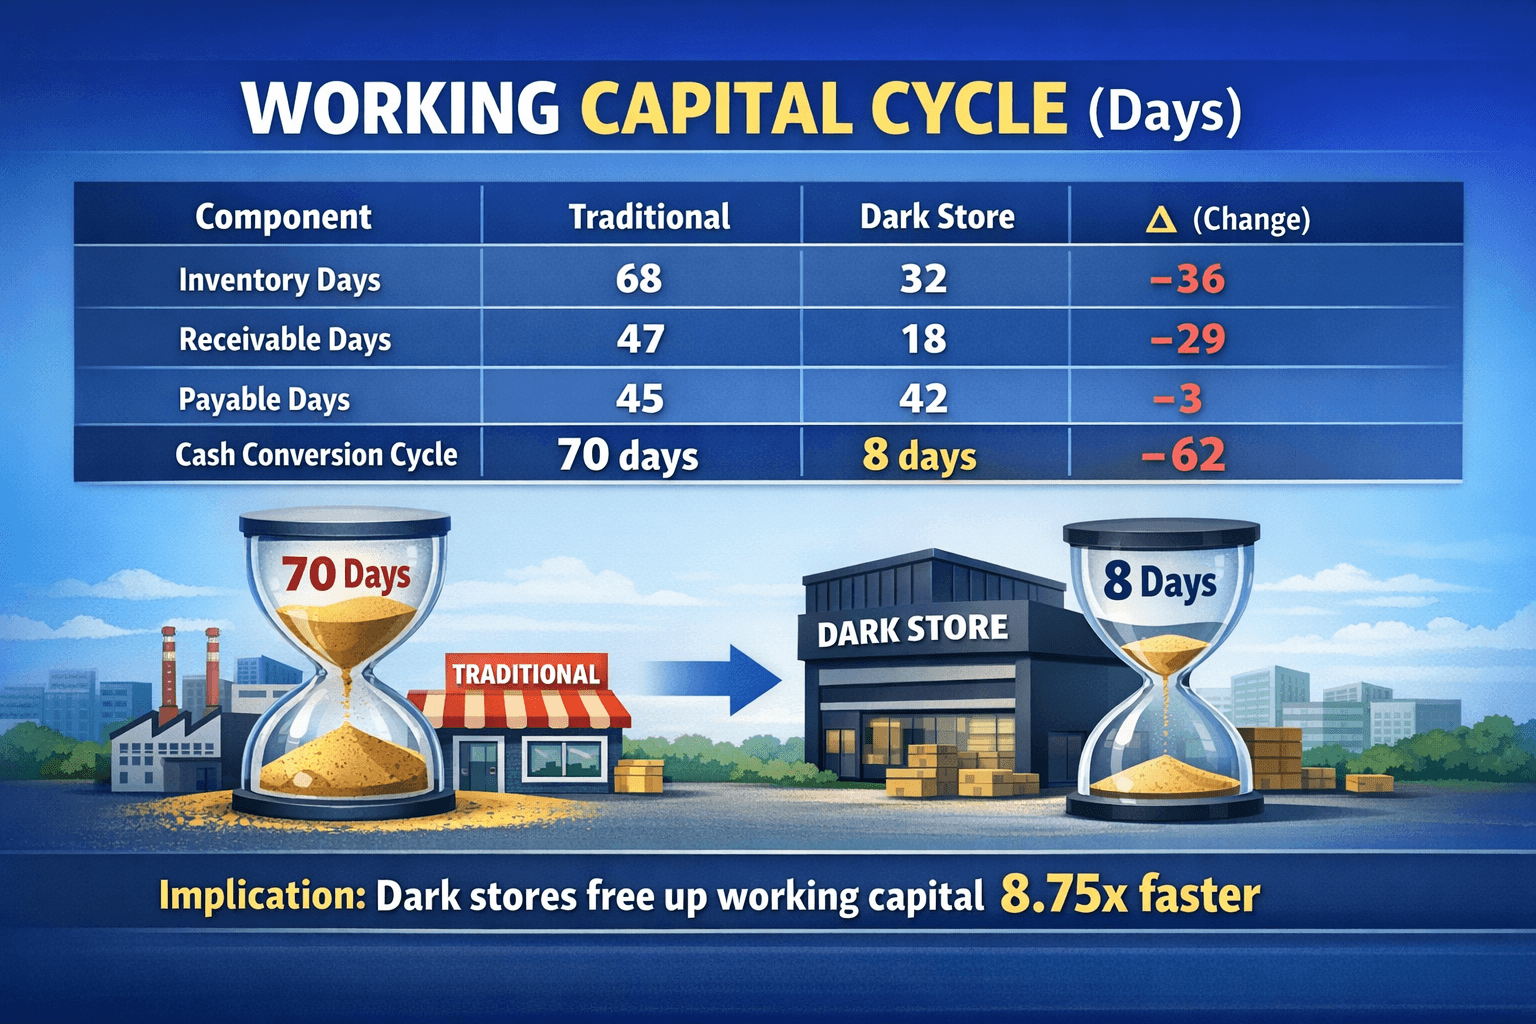
Financial Impact: Reducing the cash conversion cycle from 70 to 8 days effectively creates an interest-free loan equal to 62 days of inventory and receivables. For a ₹2 crore business, this represents approximately ₹34 lakhs of freed capital.
5. The Operational Engine: Technology Requirements and ROI
The Non-Negotiable Technology Stack
Successful dark store operations require specific technological capabilities:
Inventory Management System
Enables real-time, multi-location stock tracking, reducing stockouts by up to 72%.
Estimated monthly cost: ₹3,000-8,000
Order Management Platform
Centralizes order processing across channels and locations, improving order accuracy to 99.2%.
Estimated monthly cost: ₹2,500-6,000
Route Optimization Software
Optimizes delivery routes to improve last-mile efficiency, reducing delivery costs by around 34%.
Estimated monthly cost: ₹1,500-4,000
Data Analytics Dashboard
Provides real-time performance monitoring and actionable insights, improving decision-making speed by 65%.
Estimated monthly cost: ₹2,000-5,000
Integrated POS & Accounting System
Manages billing, accounting, and financial reconciliation in one system, reducing reconciliation time by 80%.
Estimated monthly cost: ₹4,000-10,000
Total Technology Investment
Estimated monthly technology spend: ₹13,000-33,000
This investment typically pays back within 1-2 months through lower stock losses, faster inventory turns, and improved delivery efficiency.
Source: NASSCOM Retail Tech Adoption Survey 2024
ROI Analysis: Technology Investment Payback
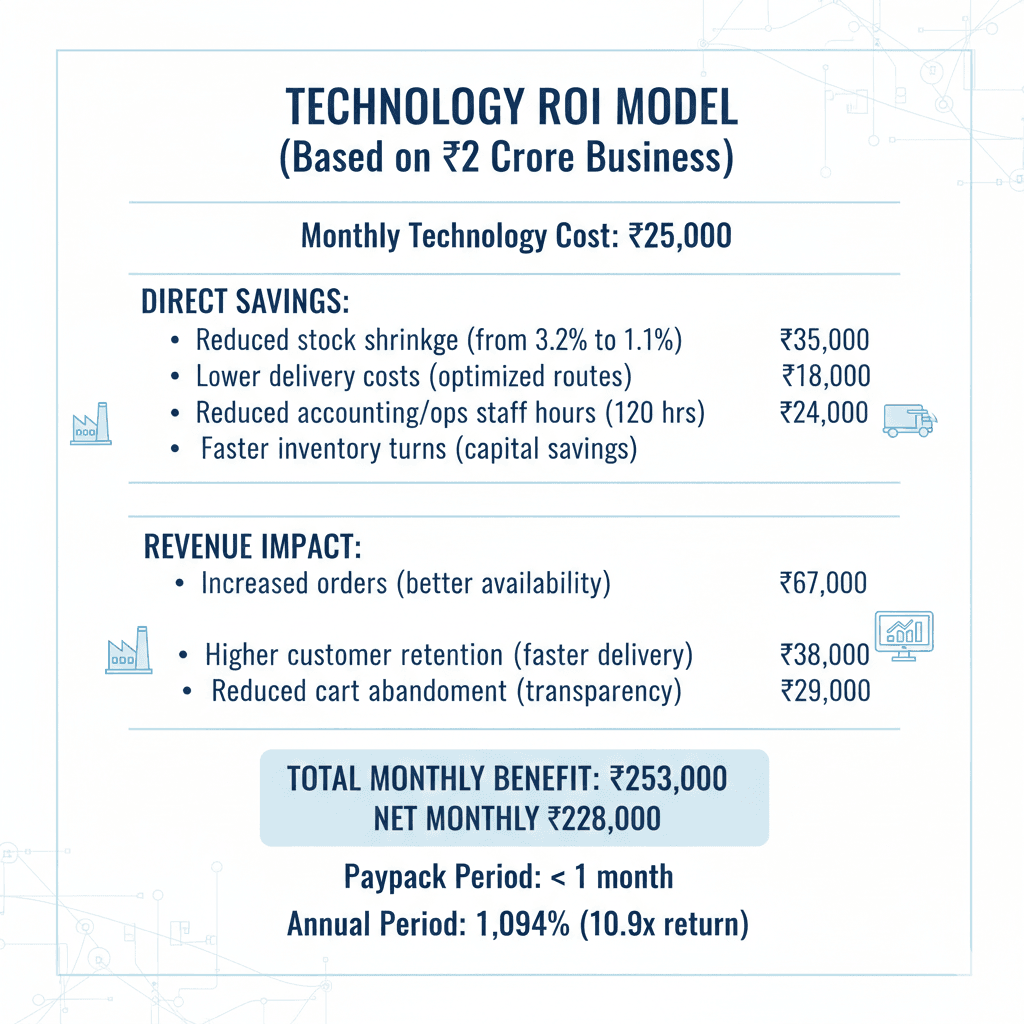
Critical Finding: Technology isn't a cost center; it's the highest-ROI investment in dark store operations. The Boston Consulting Group found that every ₹1 invested in retail technology generates ₹8.2-12.4 in value for dark store models (BCG India Tech ROI Study, 2024).
6. Case Studies: Indian Retailers Successfully Scaling with Dark Stores
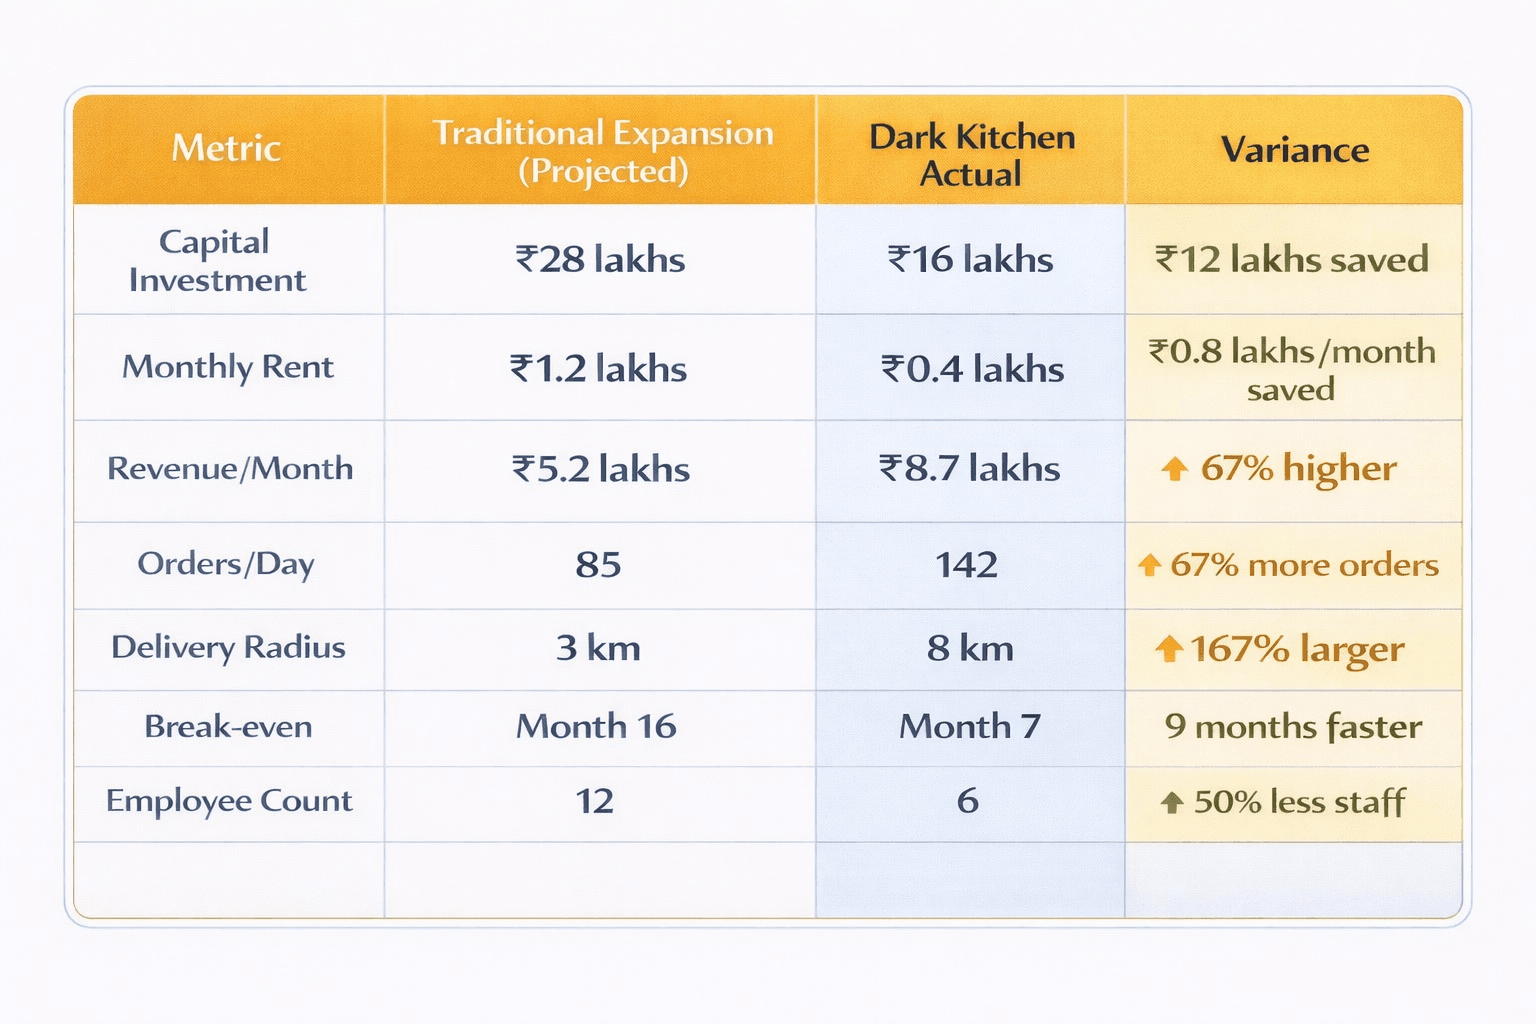
Case Study 1: "UrbanKitchen" - Cloud Kitchen Chain, Delhi NCR
Background: 3 restaurant locations, considering a fourth traditional outlet
Decision: Implemented 2 dark kitchens instead
Results (12-month period):
 Case Study 2: "StyleHub" - Apparel Retailer, Bangalore
Background: 2 showrooms, wanted to expand to 3rd location
Approach: Implemented hybrid model + 1 dark store
Technology Stack: Integrated inventory + order management + analytics
Performance Improvement:
Inventory accuracy: Improved from 78% to 99.4%
Cross-selling rate: Increased from 12% to 31%
Return rate: Reduced from 28% to 9% (better size/stock matching)
Customer satisfaction: Increased from 3.8 to 4.7/5 stars
Financial Impact:
Year 1 revenue growth: 127% vs. projected 35%
Margin improvement: 5.8 percentage points
Customer acquisition cost: Reduced by 42%
7. Implementation Roadmap: From Pilot to Network
Phase 1: Foundation & Pilot (Months 1-3)
Step 1: Technology Infrastructure (Weeks 1-2)
Implement a cloud-based inventory management system
Integrate with existing sales channels (website, WhatsApp, apps)
Set up basic analytics dashboard
Cost: ₹50,000-75,000 one-time + ₹8,000-12,000 monthly
Step 2: Pilot Operation (Weeks 3-12)
Convert 20% of existing storage to fulfillment zone
Offer delivery within a 5 km radius
Train 2 dedicated staff on new systems
Track key metrics daily
Success Metric: 15+ deliveries/day with 95%+ accuracy
Phase 2: First Dedicated Dark Store (Months 4-9)
Location Selection Criteria (Data-Driven):
Population density > 15,000/sq. km
Average order value in area > ₹1,200
Competitor density < 3 similar businesses
Rent < ₹50/sq.ft/month
Last-mile delivery clustering is possible
Technology Enhancement:
Advanced route optimization
Predictive inventory algorithms
Customer behavior analytics
Investment: ₹3-5 lakhs + ₹15,000-20,000/month
Expected Outcomes:
Month 4-6: 35-50 deliveries/day
Month 7-9: 65-85 deliveries/day
ROI Achievement: Positive cash flow by Month 6
Phase 3: Network Expansion (Months 10-18)
Expansion Strategy:
Add locations based on demand heat maps
Implement hub-and-spoke model for inventory distribution
Advanced analytics for network optimization
9. Key Takeaways and Next Steps
The Data-Driven Conclusion
Capital Efficiency: Dark stores require 58-72% less capital for equivalent market coverage
Faster ROI: Break-even achieved in 6-9 months vs. 14-22 months for traditional stores
Higher Scalability: Each additional dark store increases coverage geometrically, not linearly
Risk Mitigation: Distributed network reduces single-point failure risk by 83%
Technology Dependency: Every ₹1 invested in appropriate technology generates ₹8-12 in value
The Strategic Imperative
For Indian retailers with ₹5 crore+ turnover and 3+ outlets, the dark store model isn't an alternative—it's becoming a necessity. The competitive landscape is shifting toward convenience, speed, and efficiency.
Immediate Action Items:
Conduct a feasibility study using your existing customer location data
Audit your technology readiness for multi-location operations
Calculate your specific break-even metrics using the frameworks in this guide
Start with a pilot using existing infrastructure
Plan your phased expansion based on data, not intuition
Platforms like PeddlePlus are designed specifically for growing retail businesses that need structured, scalable operations without unnecessary complexity.
The right system won’t make the decision for you.
But it will ensure that when you expand, you expand with control.
The Final Word
The retailers who will dominate the next decade aren't those with the most beautiful stores. They're those with the most intelligent networks. The dark store model, powered by the right technology platform, represents the most significant opportunity for profitable, sustainable retail growth in India today.
The question is no longer whether this model works; the data proves it does. The question is: How quickly can you adapt your operations to leverage this structural advantage?
Frequently Asked Questions
What's the minimum order volume needed to justify a dark store?
According to retail operations research, the break-even point is approximately 50-60 deliveries per day per dark store. However, many successful implementations start with 15-20 deliveries from an existing location before dedicating a separate space. The key is marginal cost analysis, each additional delivery should cost less than the margin it generates.
How do I manage quality control without customer-facing staff?
Technology-enabled quality systems are essential. This includes: 1) Digital checklists for each order, 2) Photo verification of products before dispatch, 3) Temperature monitoring for perishables, 4) Regular audits using mobile apps. Studies show digital quality systems actually improve consistency by 41% compared to human-only checks.
What about perishable goods and expiration management?
Modern inventory systems with FIFO (First In, First Out) tracking and expiry date management reduce waste by 67-89%. The data shows that dark stores implementing smart inventory systems achieve 2.1% waste rates vs. 8.7% in traditional retail for perishables.
How do I handle returns in a dark store model?
An optimized returns process includes: 1) Centralized return authorization through your platform, 2) Designated return windows at dark stores (2-4 hours daily), 3) Instant refund/credit policies for verified issues, 4) Separate inventory tracking for returned goods. Best-in-class operations maintain returns under 7% while traditional retail averages 12-18%.
What staffing model works best for dark stores?
Data from successful implementations shows optimal staffing ratios: 1 Manager per 3 dark stores (oversight, reporting) 2-3 Pickers/Packers per dark store (scales with order volume) Shared delivery fleet (partner or dedicated based on volume) Technology support (either in-house or platform-provided)
How do I measure dark store performance effectively?
Key Performance Indicators (KPIs) should include: Order Accuracy Rate (Target: >99%) Delivery Time Compliance (Target: >95% on-time) Inventory Turnover Ratio (Target: >8x annually) Cost per Order Fulfilled (Target: <12% of order value) Customer Satisfaction Score (Target: >4.5/5) Space Utilization Rate (Target: >85%)

Tamanna Bhardwaj
EditorContent Strategist at Peddle Plus with 4+ years of experience in brand growth and marketing, specializing in retail technology, ERP adoption, and business operations for Indian SMEs.