Inventory Shrinkage: What It Is, Why It Hurts, and How to Stop It in 2026
The real story behind your missing inventory.
Control Inventory Shrinkage: 7 Practical Strategies for Indian Retail Owners
Table of Contents
- The Hidden Leak Draining Your Profits
- The Problem in Numbers
- What Exactly Is Inventory Shrinkage?
- The 4 Ways Stock Disappears
- How Shrinkage Varies by Industry: A Category Breakdown
- The Hidden Costs of Shrinkage You Can't Afford to Ignore
- 7 Practical Strategies to Bring Shrinkage Under Control
- Your 30-Day Shrinkage Action Plan
- Frequently Asked Questions
- Conclusion: Shrinkage can be Solved
The Hidden Leak Draining Your Profits
You ordered 200 units. Your system says 180 remain after sales. But when someone physically walks the shelves, only 162 are there. Where did the other 18 go? You did not sell them. They were not returned. They simply vanished and every single one represents money your business will never recover.
This is inventory shrinkage in its most tangible form: the gap between what your records say you own and what actually sits on your shelves. It sounds like a minor accounting headache. In reality, it is a profit problem, a morale problem, a pricing problem, and in severe cases, a business continuity problem. Globally, retail shrinkage costs businesses over $100 billion every year and the number is rising.
For Indian retail business owners, whether you run a kirana store, a supermarket, a garments shop, a consumer electronics outlet, or a multi-branch chain, the challenge is real and measurable. Most business owners know shrinkage exists but do not know exactly how much they are losing or where it is coming from. That uncertainty is exactly where this guide starts.
The Problem in Numbers
Before breaking down causes and solutions, the numbers put the problem in perspective. The following data is drawn from the National Retail Federation (NRF), the Council on Criminal Justice, and global retail loss prevention research from 2022 to 2024.
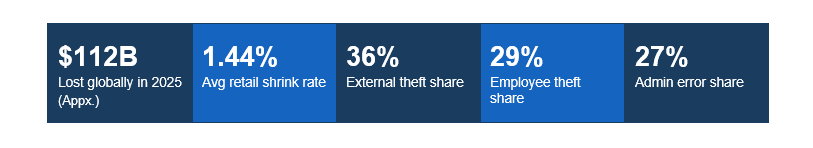 To ground this in Indian retail terms: a store doing ₹2 crore in annual stock turnover loses approximately ₹2.9 lakh to shrinkage every year at the global average rate. A supermarket or multi-branch retailer doing ₹10 crore loses over ₹14 lakh annually, not from bad sales or poor products, but from gaps in operations that are largely preventable.
More Data Points Worth Knowing
• Shoplifting increased by 24% in the first half of 2024 (Council on Criminal Justice).
• 88% of retailers report shoplifters are becoming more aggressive.
• 85% of small businesses face shoplifting at least once per year.
• 64% of small business owners raised prices specifically to compensate for theft and fraud losses.
• Organized Retail Crime (ORC) accounts for over $45 billion in losses annually across small specialty retailers.
• In food retail, spoilage and damage account for 2.5-4% of potential revenue, the highest damage-related shrink of any sub-sector.
• Businesses with 31-40 employees report internal theft at 90%, vs. 77% for those with 21-30 employees. Risk scales with team size.
• The industry average shrink rate hit an all-time high of 1.62% in 2020 and has not returned to pre-2019 levels since.
💡 Industry Benchmark:
An acceptable shrinkage rate is generally under 1% of total inventory value. Anything above 2% is a serious red flag. Most retailers without structured loss prevention operate between 1.5% and 3%.
What Exactly Is Inventory Shrinkage?
Inventory shrinkage is the measured difference between the inventory your records show and the inventory that physically exists. The formula is straightforward:
Inventory Shrinkage = Recorded Inventory − Actual Inventory
Shrinkage Rate (%) = (Shrinkage ÷ Recorded Inventory) × 100
If your books show 1,000 units but a physical count reveals 940, your shrinkage is 60 units. Expressed as a percentage, that is 6% more than 4 times the industry average, and a number that demands immediate investigation.
📌Worked Example (Indian Context):
A grocery store’s system records ₹5,00,000 in stock after all sales are accounted for. A physical count shows ₹4,40,000. Shrinkage=₹60,000. Shrinkage rate=12%. For a business running on 15-18% gross margins, that single figure has wiped out nearly a full month of profit.
The 3 Types of Shrinkage
Not all shrinkage is the same, and understanding the type shapes the correct response. Physical loss means items are genuinely gone - stolen, unaccounted for, or lost in transit. Damage means items still exist but cannot be sold at full value due to breakage, spoilage, or quality degradation. Operational error means your records were wrong to begin with a counting mistake, a barcode scanned twice, or a receiving discrepancy that inflated your book inventory. Generic “install cameras” advice addresses only the first type. All 3 require different interventions.
The 4 Ways Stock Disappears
Most businesses losing more than 1% of inventory are being hit from multiple directions simultaneously. Addressing only one cause typically produces only modest improvement. Here is a clear-eyed breakdown of each factor.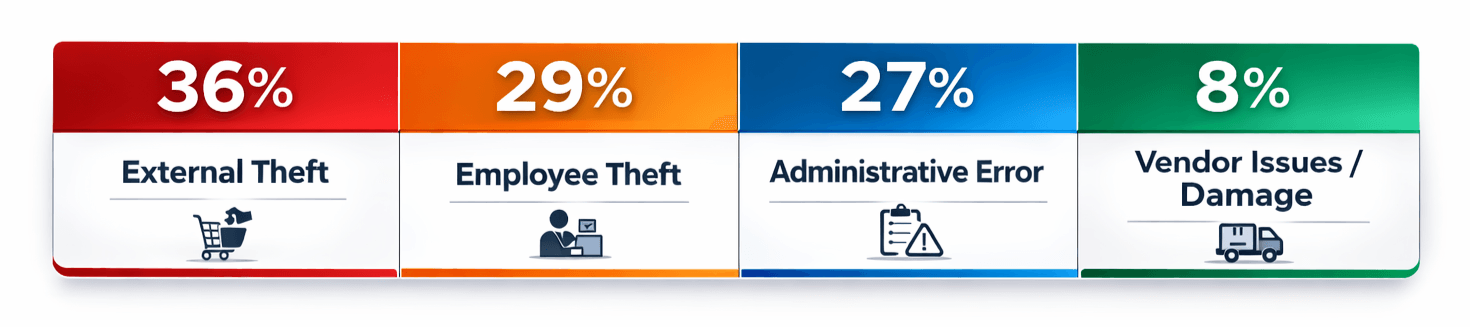
External Theft (~36%) – Shoplifting, organized retail crime, price tag swapping
Employee Theft (~29%) – Merchandise theft, fraudulent returns, register skimming, discount abuse
Administrative Error (~27%) – Mislabeling, incorrect counts, pricing errors, data entry mistakes
Vendor Issues / Damage (~8%) – Short shipments, spoilage, improper storage, transit damage
External Theft: More Organized Than You Think
Individual shoplifting is a significant contributor, but the fastest-growing threat is Organized Retail Crime (ORC) - coordinated groups that steal merchandise specifically to resell it through secondary markets or online platforms. These groups are systematic: they identify high-demand items with predictable resale value, rotate across multiple store locations, and are difficult to prosecute because they operate in teams. Nearly 67% of asset protection managers reported a meaningful increase in ORC in recent surveys. Price tag swapping is a related, often overlooked form, a customer pays for a cheap item’s barcode while taking a more expensive product, so the transaction looks legitimate in your system.
Employee Theft: The Harder Conversation
Internal theft accounts for nearly 30% of all retail shrinkage and is frequently the most uncomfortable cause to acknowledge. It goes far beyond simply pocketing merchandise. Cashiers issuing refunds for items never returned, warehouse staff taking products off the loading dock, managers manipulating discount or gift card balances, these are harder to detect than shoplifting and accumulate quietly over longer periods. The NRF’s research shows the risk rises with team size, making this a particularly important area to monitor for businesses scaling their headcount.
Administrative and Operational Errors: The Silent Majority
More than a quarter of all inventory losses are caused by nobody stealing anything. A decimal point in the wrong place on a purchase order. A barcode scanned twice during receiving. A markdown applied to 50 units when only 5 were intended. An expired product disposed of without being logged. A manual count where one shelf was skipped. None of these feel dramatic individually, but they compound into a material financial problem. The critical distinction from theft: administrative shrinkage does not always mean the items are physically lost, but it does mean your inventory data is unreliable, and unreliable data drives poor purchasing, late reorders, and missed sales.
Vendor Issues and Product Damage: The External Wild Card
A supplier that consistently delivers 97 units against an invoice for 100 may go unchallenged for years if the buyer never counts at receiving. Product damage from improper storage or handling is frequently under-reported because staff members who cause it may not record it accurately. For Indian retailers dealing in perishables, cosmetics, or pharmaceuticals, expiry and spoilage are constant concerns. The First In, First Out (FIFO) principle is simple in theory but routinely violated under operational pressure, and every item that expires before it can be sold is a direct subtraction from margin.
How Shrinkage Varies by Industry: A Category Breakdown
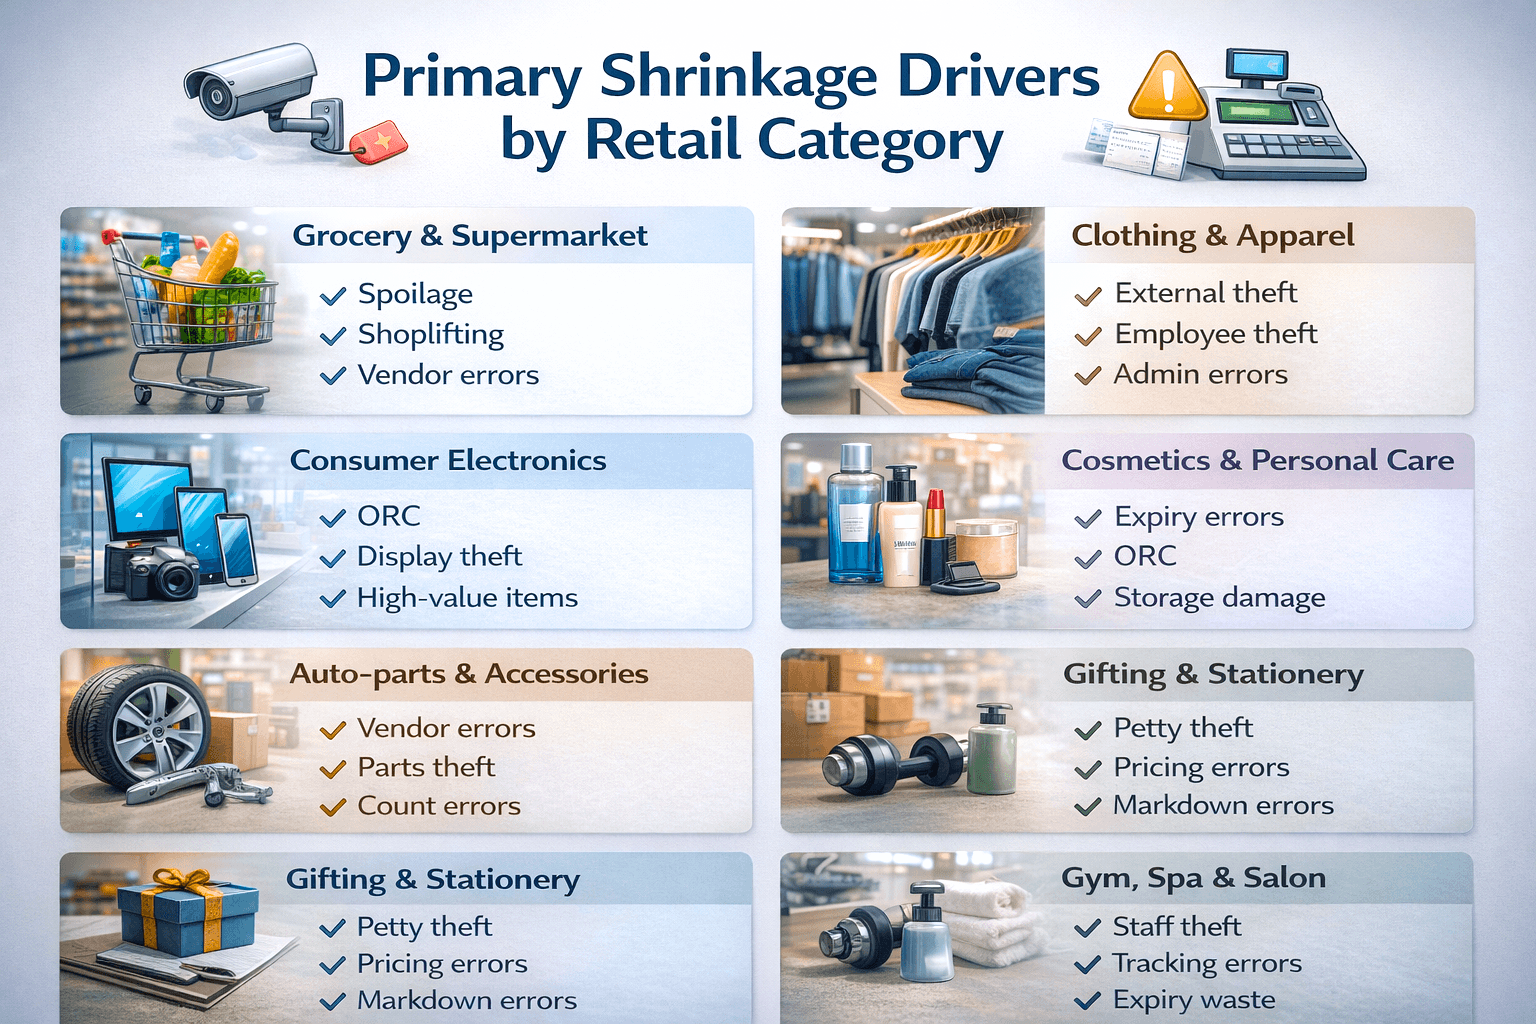
Shrinkage does not affect all retail categories equally. Your industry, product mix, and store format shape both the rate of loss and which causes dominate. Peddle Plus One ERP serves retailers across a wide range of sectors in India, UAE, and Africa, and the patterns below reflect what we consistently see on the ground.
 Grocery & Supermarket
Shrinkage in grocery and supermarket formats is largely driven by spoilage, which typically accounts for 2.5–4% of revenue due to perishables expiring before sale. High-value FMCG items are frequent targets of shoplifting because they are compact, easy to conceal, and quick to resell. Vendor short deliveries also contribute when shipment quantities do not match purchase orders. Additionally, weighing and barcode errors at the POS create billing and inventory mismatches.
Clothing & Apparel
In apparel retail, shrinkage is primarily linked to external theft of branded and high-demand items. Employee merchandise theft is another contributor, especially in stores with large backroom inventories. The high SKU complexity created by multiple sizes, colors, and styles increases the risk of stock counting errors and administrative inaccuracies that are difficult to detect quickly.
Consumer Electronics
Consumer electronics face significant shrinkage risk because of high unit values, where even a single missing item materially impacts margins. Organized retail crime (ORC) often targets premium gadgets for resale in secondary markets. Additionally, display units and demo stock are particularly vulnerable if security controls are not strong.
Cosmetics & Personal Care
Shrinkage in cosmetics and personal care retail commonly arises from weak batch and expiry tracking processes. These products are also attractive to organized theft due to their high resale value and compact size. Improper storage conditions, such as exposure to heat or humidity, can further lead to product damage and unsellable inventory.
Auto-parts & Accessories
In the auto-parts segment, vendor short shipments in bulk deliveries often go unnoticed during receiving. Small, high-value components are susceptible to employee theft. Furthermore, the presence of similar-looking SKUs frequently results in misidentification and counting errors during stock audits.
Gifting & Stationery
Shrinkage in gifting and stationery is typically driven by petty pilferage of small items that are easy to conceal. Incorrect pricing or billing errors at POS systems also contribute. During promotional periods, manual markdown mistakes can create discrepancies, while fragile items are prone to damage from customer handling.
Gym, Spa & Salon
In gym, spa, and salon formats, shrinkage often occurs through unrecorded use or pilferage of retail products by staff. Inaccurate tracking of service supplies leads to inventory inconsistencies, especially when consumption is not logged per treatment. Additionally, slow-moving wellness and beauty products may expire before being sold, contributing to wastage.
Understanding where your sector sits helps you prioritize where to act first. A grocery business should tackle spoilage and vendor verification before investing in RFID. A garments retailer needs robust theft deterrence and employee controls before overhauling inventory software. The right sequence matters as much as the right intervention.
The Hidden Costs of Shrinkage You Can't Afford to Ignore
Inventory shrinkage’s impact radiates well beyond the immediate loss of goods. It creates a chain of secondary effects that affect areas of the business which at first glance seem unrelated.
The most direct damage is to profit margins. Retail is a low-margin business in most categories. At a 1.5% shrinkage rate, a business running 12% net margins loses roughly 12.5% of its take-home profit to inventory loss alone. At 3%, that becomes 25% of net profit gone before any reinvestment decision is possible. These are not theoretical numbers. They are the difference between a business that grows and one that plateaus despite healthy revenue.
Shrinkage also corrupts your inventory data, and corrupted data is a silent but constant cost. When your system shows stock that does not exist, you underorder products running low and overorder products you still have. Stock-outs occur not because demand spiked but because your numbers were wrong. Customers facing empty shelves do not just leave, research shows 30-40% of customers who experience a stock-out will buy from a competitor that same day, and a meaningful proportion do not return.
The operational cost of managing shrinkage is frequently underestimated. Security infrastructure, extra staff, investigation time, and management attention pulled from growth activities all represent real, ongoing costs. And when shrinkage forces price increases to compensate for losses, you are asking your loyal customers to pay for your operational gaps, creating a competitive vulnerability against retailers who have tighter systems.
⚠️ The Effect Most Retailers Never Account For:
64% of small business owners raised their prices to offset theft and fraud losses. Every price increase driven by shrinkage rather than genuine cost increases gives price-sensitive customers a reason to look for alternatives. In today’s competitive retail environment where consumers compare options instantly online, vulnerability is what you cannot afford to carry.
7 Practical Strategies to Bring Shrinkage Under Control
No single intervention solves shrinkage because no single cause drives it. Effective loss prevention layers multiple strategies that address different root causes simultaneously. These 7 approaches consistently produce results across different retail formats and business sizes.
1. Shift from Annual Counts to Continuous Cycle Counting
Most businesses count their full inventory once or twice a year. That interval means a shrinkage problem can grow for 6 months before anyone detects it. Cycle counting - counting a defined subset of your inventory on a rolling weekly basis, converts reconciliation from a periodic event into an ongoing monitoring system. Discrepancies surface within weeks, and patterns become visible: a specific product category consistently running short, a particular shift where variances concentrate, a store location with elevated losses. Cycle counting does not eliminate shrinkage, but it makes it visible early enough to respond before the losses become serious.
2. Connect Your Inventory and Billing System in Real Time
Manual stock management creates the gaps where shrinkage hides. When a sale is not immediately reflected in stock levels, or when receiving is logged separately from inventory records, discrepancies accumulate silently between updates. A connected billing and inventory platform adjusts stock levels with every transaction, flags variances between expected and physical counts, and generates reporting that surfaces patterns rather than just numbers. For Indian retailers, the added layer is GST compliance- when your billing system is disconnected from your inventory, e-invoicing errors and GSTR reconciliation problems multiply. A unified system eliminates both sources of leakage simultaneously.
3. Build Role-Based Access Controls Around Sensitive Operations
Not every staff member needs access to every function in your billing or inventory system. A new cashier should not be able to process refunds without manager authorization, void transactions independently, or adjust stock levels. Role-based access controls create accountability by design, every sensitive action requires sign-off, every sign-off is logged, and the log creates an audit trail. This does not eliminate internal theft, but it raises the effort required significantly, deters opportunistic behavior, and makes investigation far easier when discrepancies appear. Enable blind cash counts: cashiers count their drawer first, then the system reveals the expected amount. This single change makes petty cash skimming considerably harder.
4. Design Your Store Layout as a Passive Loss Prevention Tool
Retail layout decisions have significant loss prevention implications that most business owners overlook because they are thinking about display appeal. Blind corners and tall shelving create unobserved areas where theft concentrates. High-value items near the back of a large store are harder to monitor than those placed within line of sight of staffed areas. Cash registers at store exits mean every customer passes a staffed checkpoint on the way out. Good lighting throughout the store including storage areas and loading docks discourages theft without requiring additional staffing or technology. These are zero-cost changes that reduce losses consistently.
5. Make Your Team Your First Line of Defense
An alert, customer-engaged team is one of the most effective theft deterrents available and it requires no additional budget beyond good training. A genuine greeting to every person entering the store signals attentiveness and removes the anonymity casual shoplifters depend on. Staff who understand the common patterns of shoplifting, return fraud, and discount manipulation can respond appropriately without confrontation. Equally important: train your team on administrative accuracy. The correct way to receive a shipment, how to log damaged or expired stock, how to process a markdown so the system reflects reality. Every minute invested in this training has a measurable return in reduced losses.
6. Systematize Receiving and Vendor Verification
Every delivery should be counted and verified against the purchase order before the vehicle leaves. In practice, the pressure of a busy receiving area leads to assumptions that get exploited. Build a receiving checklist that your team follows consistently: count quantities, inspect for damage, verify product quality against specifications, and log any shortfall immediately. For vendors with a history of issues, document discrepancies in writing and escalate formally. A vendor who knows you count every delivery is significantly less likely to short you than one who knows you trust without verifying. This is especially relevant for Indian retailers dealing with bulk suppliers across FMCG, apparel, and auto parts.
7. Tighten Returns and Refund Policies to Close Fraud Loops
Return fraud - customers returning stolen merchandise for cash, or employees processing fake refunds is a consistent and underappreciated contributor to shrinkage. Requiring a receipt for cash refunds, mandating ID verification for returns, and routing all refunds through manager-level authorization are controls that significantly reduce this risk. For most honest customers, these are minor inconveniences. For fraud schemes, they are effective barriers. Review your refund data regularly: an unusual concentration of returns from a specific cashier, during specific shifts, or for specific product categories is a pattern worth investigating before it grows.
Your 30-Day Shrinkage Action Plan
If you want to start making progress this month rather than overhauling everything at once, these weekly actions build momentum without overwhelming your team.
Week 1: Measure First
- Calculate your current shrinkage rate using your last inventory count. If you’ve never done this formally, start now. You cannot manage what you have not measured.
- Pull your refund and void reports for the last 60 days and look for patterns: specific employees, specific times, specific product categories.
- Identify your top 5 highest-risk SKUs- high value, small size, easy to conceal, or historically problematic for your first focused cycle count.
Week 2: Close the Easy Gaps
- Review your system access permissions. Remove sensitive functions from users who do not need them for their current role.
- Enable blind cash counts at all billing counters.
- Create or update your receiving checklist and brief your receiving team on why every count matters.
Week 3: Train and Communicate
- Run a 30-minute team session on common shoplifting patterns, return fraud tactics, and how staff should respond.
- Review your returns policy. If receipts and ID are not currently required, update the policy now.
- Walk your store and identify any layout blind spots where activity cannot be observed from a staffed position.
Week 4: Build the Ongoing System
- Set your cycle counting schedule for the next quarter: which SKUs, which frequency, who owns it.
- Evaluate whether your current billing and inventory system gives you real-time stock visibility. If not, this is the highest-leverage upgrade available to you.
- Create a simple monthly shrinkage report so you can track your rate over time and measure whether your interventions are working.
Frequently Asked Questions
Q: What is a good shrinkage rate for a retail business?
A: The industry average is around 1.44% of total inventory value. Most loss prevention professionals target below 1%. Anything consistently above 2% warrants immediate investigation. For high-value categories like electronics or jewelry, even a 0.5% rate can translate into significant absolute losses given the unit values involved.
Q: Is inventory shrinkage tax deductible in India?
A: Yes, in most cases, but only if properly documented. Inventory losses due to theft, damage, or spoilage can be claimed as business expenses under Indian income tax law, provided you maintain supporting records: inventory count reports, police complaints for theft incidents, and disposal records for damaged or expired goods. Undocumented shrinkage that simply appears as a gap in your books increases audit risk. Consult a CA familiar with your specific business type for precise guidance.
Q: How is inventory shrinkage different from COGS?
A: Cost of Goods Sold (COGS) represents the cost of inventory sold to customers, a normal & expected business expense. Shrinkage represents inventory lost for reasons other than sales: theft, damage, spoilage, or administrative error. They are recorded differently. COGS reduces inventory as sales occur; shrinkage appears as an additional expense line. Treating shrinkage as part of COGS without identifying it separately is common but dangerous, it masks the true scale of operational losses and prevents meaningful corrective action.
Q: What is the difference between shrinkage and wastage?
A: Wastage specifically refers to losses due to perishability, spoilage, or natural degradation — most common in food service, grocery, and pharmaceutical businesses. Shrinkage is the broader category that includes wastage plus theft, administrative error, and damage. In practice, tracking wastage separately from theft and error losses is valuable because the solutions are completely different. FIFO discipline and temperature management address wastage. Access controls and loss prevention training address theft. A single “shrinkage” line that combines all of these makes it harder to act effectively.
Q: Can a small kirana or single-outlet retailer benefit from inventory management software?
A: Absolutely. Many of the most impactful shrinkage interventions are free, better receiving procedures, tighter returns policies, and access controls in your billing software cost nothing beyond the time to implement them. Where software investment is relevant, modern cloud-based inventory management has become affordable at almost any business size. For a kirana or small format store, the primary gains are in reducing administrative errors, catching billing discrepancies quickly, and ensuring GST compliance without manual effort. The cost of not having visibility into your inventory almost always exceeds the cost of a basic management system.
Q: How does Peddle Plus One ERP help reduce inventory shrinkage specifically?
A: Peddle Plus One ERP addresses shrinkage from multiple directions simultaneously. Real-time inventory tracking means discrepancies surface immediately rather than accumulating between annual counts. Integrated GST billing eliminates the manual data entry errors that cause administrative shrinkage. Role-based access controls limit exposure to internal theft. Multi-device management means you can monitor stock levels from anywhere, not just from a single desk in the store. And integration with Tally and Zoho Books ensures your financial records stay aligned with your physical inventory. For businesses across our supported sectors - grocery, apparel, electronics, cosmetics, and more — these features directly address the most common sources of retail shrinkage.
Q: How often should I do a full physical inventory count?
A: Most retailers conduct a full count once or twice per year, aligned with financial year-end. However, relying solely on annual counts means shrinkage accumulates for too long before detection. The best practice is to supplement full counts with ongoing cycle counting of high-risk SKUs throughout the year. For product categories with high theft rates or significant value concentration, weekly cycle counts of those specific items are not excessive and are often the fastest way to identify where losses are occurring.
Conclusion: Shrinkage can be Solved
Inventory shrinkage is not an unavoidable cost of running a retail business atleast not at the scale most retailers suffer it. It is a problem with identifiable causes and proven responses. The businesses that manage it most effectively are not always those with the most sophisticated technology or the largest loss prevention teams. They are the ones that look clearly at where their losses are coming from, close the easiest gaps first, and build systems that make shrinkage visible, measurable, and consistently declining over time.
Start with measurement. Calculate your current shrinkage rate before doing anything else. Once you know the number and have a sense of whether theft, administrative error, vendor issues, or spoilage is the dominant driver, every subsequent decision becomes more targeted and more effective. You stop investing in solutions to problems you may not have and start addressing the gaps that are actually costing you.
The goal is not a zero-shrinkage business, which is an unrealistic standard for any operation handling physical goods at scale. The goal is a business where shrinkage is low, well-understood, and trending downward. That is a business with healthier margins, more accurate purchasing decisions, fewer stock-outs, and more confident growth — exactly the kind of business Peddle Plus One ERP is built to help you run.
Peddle Plus One ERP
A comprehensive retail management platform designed to simplify operations and improve control.
Supporting businesses across India, the UAE, and Africa | Presence in 10+ cities
peddleplus.in | sales@peddleplus.in
| +91-76783 00366